Branson Transit Study
Travel
Demand Analysis –
Ridership
Technical Memorandum
February 9, 2006
 |
prepared
for:
prepared by:
![]() City of
City of
Jacobs Civil Inc.
EXECUTIVE
SUMMARY
The City of
The methodology developed to forecast future transit ridership in the State Route 76 corridor is based on two functions. The first function is to estimate candidate transit trips originating outside the project study area. These external trips consist of residents and employees living outside of the study area who travel into the study area for work or other reasons. These trips also consist of visitors who are staying outside of the study area but make trips into the study area to dine, watch a show, etc. The second function is to estimate candidate transit trips originating inside the study area. These internal trips are made up of study area employees who make trips within the State Route 76 corridor during their workday to dine or run errands. Internal trips are also made up of visitors who are staying in the study area and make trips to dine, shop, or watch a show within the study area.
Three primary fixed guideway/bus alternatives were tested within the Branson State Route 76 corridor for the 2030 forecast year. Each alternative was tested with a transit fare of $.025, $1.00, $1.50, $2.00, and no fare. It was assumed that transit fares were consistent by mode and there was no transfer fare imposed. Operating headways for the guideway system were coded as 10 minutes in the peak and 20 minutes in the off-peak. Operating headways for the feeder bus routes were coded as 10 minutes in the peak and 30 minutes in the off-peak. Following is a brief description of the alternatives tested. A more detailed description can be found in the Alternatives section of the report.
Transportation System Management (TSM) Alternative
The TSM alternative
includes the Brown Line which is a six-mile-long bus line extending down
Build Alternative A
The TSM alternative Green and
Build Alternative B
The TSM alternative Green and
In addition to the
alternatives listed above, a future northwest extension using the
right-of-way of the State Route 465 Ozark Mountain High Road extension to
reach Shepherd of the Hills and
2030 ridership estimates were forecasted for the three alternatives listed above. The resulting ridership estimates appear reasonable considering the heavy tourism market in the Branson area as well as the projected future traffic congestion along the State Route 76 corridor and compare well with other similar systems around the country.
Ridership forecast results are listed below:
2030 Branson Average Daily Boardings
|
|
|
Transit
Fare |
||||
|
Alternative |
Mode |
No
Fare |
$.025 |
$1.00 |
$1.50 |
$2.00 |
|
TSM |
76 Bus |
3,508 |
3,083 |
2,130 |
1,650 |
1,276 |
|
Bus |
1,517 |
1,323 |
895 |
695 |
526 |
|
|
Build A |
Guideway |
14,452 |
12,949 |
9,320 |
7,421 |
5,874 |
|
Bus |
2,966 |
2,622 |
1,818 |
1,389 |
1,078 |
|
|
Change from TSM |
Guideway |
10,944 |
9,866 |
7,190 |
5,771 |
4,598 |
|
Bus |
1,449 |
1,299 |
923 |
694 |
552 |
|
|
Build B |
Guideway |
16,623 |
14,891 |
10,669 |
8,460 |
6,690 |
|
Bus |
3,735 |
3,315 |
2,285 |
1,779 |
1,372 |
|
|
Change from TSM |
Guideway |
13,115 |
11,808 |
8,539 |
6,810 |
5,414 |
|
Bus |
2,218 |
1,992 |
1,390 |
1,084 |
846 |
|
An approximately 4 mile future northwest extension providing access to Shepherd of the Hills and Silver Dollar City was also tested and resulted in an average net increase of approximately 1,500 boardings per day.
Branson Travel Demand Analysis –
Ridership Technical Memorandum
INTRODUCTION
The City of
The methodology developed to forecast future transit ridership in the State Route 76 corridor is based on two functions. The first function is to estimate candidate transit trips originating outside the project study area. These external trips are made up of residents and employees living outside of the study area who travel into the study area for work or other reasons. These trips are also made up of visitors who are staying outside of the study area but make trips into the study area to dine, watch a show, etc… The second function is to estimate candidate transit trips originating inside the study area. These internal trips are made up of study area employees who make trips within the State Route 76 corridor during their workday to dine or run errands. Internal trips are also made up of visitors who are staying in the study area and make trips to dine, shop, or watch a show within the study area.
BACKGROUND
The primary forecasting tool used to project transit ridership was a modification of the Branson Transportation Model developed in conjunction with the November 2001 Branson Comprehensive Transportation Plan. The model network as well as the Traffic Analysis Zone (TAZ) structure and associated socioeconomic data were reviewed and modified to reflect current and future characteristics of the resident, employment, and visitor population in the Branson area. Since the original Branson Model was a highway-only model, a mode choice model was developed and incorporated into a new transit model that evaluates future transit alternatives. For ridership forecasting purposes, a 2005 Base Year Model was developed along with a 2030 Future Year Model to be used for transit alternatives testing.
The success of forecasting travel demand for a fixed guideway system along the State Route 76 corridor depends on a complete understanding of the travel patterns of visitors and residents. Visitor and employee travel characteristic surveys were conducted within the study area. The goal of the surveys was to identify trip generation rates and to gain a better understanding of the travel patterns within the corridor for use in the travel demand model. Information gathered from surveys was used to establish trip rates to estimate trip distribution in the modified Branson Transportation Model.
INTERNAL TRIP ESTIMATION METHODOLOGY
The following section describes the methodology used to estimate trips internal to the study area. Based on the large number of tourist trips in the State Route 76 study area, separate visitor and employee Trip Generation and Distribution models were developed.
Visitor Trip Generation
Tourists make up the majority of the trip makers within the State Route 76 study area. A hotel generation model was developed in order to properly account for visitor trip productions by converting hotel rooms to number of visitors. Hotel characteristics data was collected from numerous sources including the Branson Lakes Area Hotel / Motel Association. The majority of the hotels in the Branson area are located directly along State Route 76 accounting for over 60% of the total hotel rooms in the region. Additional hotels are located just off State Route 76 and are within walking distance to the corridor. Figure 1 illustrates the locations of hotels within the study area.
Figure 1
Hotel / Motel
Locations within Study Area
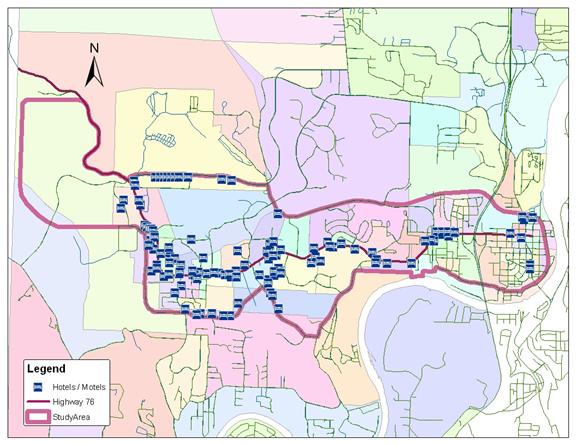
Hotels were assigned to a specific Traffic Analysis Zone (TAZ) based on geographic location. The existing TAZ structure was modified to achieve a more even distribution of hotels throughout the study area. All attractions and places, such as major theaters, restaurants and shopping centers, which are typical destinations for visitors, were assigned to the zones as well. Thus, the TAZs include both visitor origins and destinations.
Potential daily visitors by hotel was calculated using the number of rooms per hotel multiplied by the Average Peak Occupancy Ratio and the average number of visitors by room. These statistics were gathered from the hotel surveys and the Branson Lakes Area Chamber of Commerce. A future growth rate was developed based on the rate of growth of the original model’s socioeconomic data from the 1999 base year to the 2020 forecast year. This growth rate was applied to the base year visitor trip generation data to calculate the visitor trip generation for the 2030 forecast year. That rate of growth calculates to almost 2.5% a year.
Based on the visitor trip logs collected from the Visitor Trip Surveys, a Visitor Trip Rate by purpose was created. Table 1 contains visitor trip rates by purpose. Table 2 contains the associated number of visitor trip productions by purpose.
Table 1
Daily Visitor
Trip Rates by Purpose
|
From/To |
Hotel |
Theaters |
Shopping |
Restaurants |
Other |
Total |
|
Hotel |
0 |
0.38 |
0.30 |
0.66 |
0.22 |
1.57 |
|
Theaters |
0.52 |
0.01 |
0.08 |
0.12 |
0.04 |
0.80 |
|
Shopping |
0.25 |
0.12 |
0.049 |
0.24 |
0.09 |
0.76 |
|
Restaurants |
0.40 |
0.30 |
0.26 |
0 |
0.26 |
1.23 |
|
Other |
0.38 |
0.02 |
0.11 |
0.21 |
0.04 |
0.87 |
|
Total |
1.57 |
0.84 |
0.81 |
1.24 |
0.77 |
5.24 |
Table 2
Average Daily
Visitor Trip Productions by Purpose
|
From/To |
Hotel |
Theaters |
Shopping |
Restaurants |
Other |
Total |
|
Hotel |
0 |
10,795 |
8,452 |
18,465 |
6,276 |
43,988
|
|
Theaters |
14,727 |
391 |
2,371 |
3,542 |
1,367 |
22,398
|
|
Shopping |
7,085 |
3,347 |
1,367 |
6,862 |
2,566 |
21,227
|
|
Restaurants |
11,185 |
8,452 |
7,280 |
0 |
3,933 |
30,850
|
|
Other |
10,795 |
586 |
3,152 |
5,886 |
0 |
20,419
|
|
Total |
43,792
|
23,571
|
22,622
|
34,755
|
14,142
|
138,882
|
Employee Trip Generation
Another significant number of trips within the State Route 76 corridor are made by study area employees during their workday. Because the travel patterns associated with these trips differ from visitors, a separate trip generation methodology was developed.
The numbers of Employees within the study area were identified by using a list generated from InfoUSA. Employees were assigned to TAZs based on their geographic location. A future growth rate was developed based on the rate of growth of the original model’s socioeconomic data from the 1999 base year to the 2020 forecast year. This growth rate was applied to the base year employee trip generation data to calculate the employee trip generation for the 2030 forecast year. That rate of growth calculates to a little less than 2.5% a year.
An Employee Trip Rate by purpose was created using the data collected from the Employee Travel Surveys. Table 3 contains employee trip rates by purpose. Table 4 contains employee trip productions by purpose.
Table 3
Daily Employee Trip Rates by Purpose
|
Purpose |
Trip
Rate |
|
Work Based Shopping |
0.36 |
|
Work Based Restaurant |
0.41 |
|
Work Based Work Related |
0.25 |
|
Work Based Other |
0.39 |
Table 4
Average Daily Employee Trip Productions by Purpose
|
Purpose |
Productions |
|
Work Based Shopping |
10,542 |
|
Work Based Restaurant |
11,825 |
|
Work Based Work Related |
7,184 |
|
Work Based Other |
11,436 |
|
Total |
40,988 |
Visitor Trip
Distribution
Productions for visitor trips were calculated from the Trip Generation rates and their attractions were distributed across all Study Area TAZs. Then a Gravity Model was used to distribute the trips between the many different TAZs within the study area. All friction factors and skim times were set to one (1), so that it is possible for any Visitor trip to go to any other TAZ within the study area.
Employee Trip
Distribution
Just as with the visitor trips, productions for employee trips were calculated from the Trip Generation rates and their attractions were distributed across all Study Area TAZs. Then a Gravity Model was used to distribute the trips between the many different TAZs within the study area. All friction factors and skim times were set to one (1), so that it is possible for any employee trip to go to any other TAZ within the study area.
EXTERNAL-INTERNAL
TRIP ESTIMATION METHODOLOGY
A significant portion of trips in the study area to be considered for transit purposes is made by the number of visitors and residents who are traveling into the State Route 76 corridor from outside of the Study Area. These external to internal (EI) trips are captured from the original Branson model, and are distributed into the study area by the model.
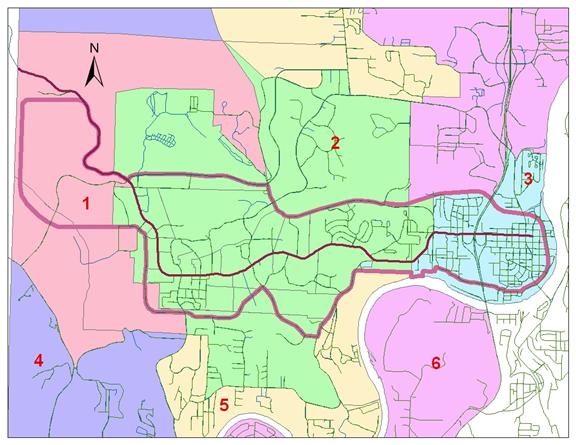
In order to capture the right combination of trips from outside of the study area, the study area TAZs and the surrounding TAZs were aggregated into 6 distinct groupings, three internal to the study area and three external to the study area. Since the State Route 76 corridor runs West-to-East, so to were the groups sub-divided, one to the West, one in the middle, and one to the East for both the study area and the surrounding area TAZs.
The following Figure 2 represents the TAZs as grouped by the 6 distinct groupings mentioned above.
Figure 2
Study Area TAZ
Groupings
For this study, it is assumed that two Park and Ride (PnR) facilities will
be developed in the 2030 future year scenarios.
Therefore, all candidate EI trip origins for the guideway system
are concentrated in the two TAZs in which these PnR facilities will be
contained. Access to the
guideway alignment will be provided via stations at the PnR facilities.
To determine the most likely candidate EI trips for the guideway system, it is most reasonable to assume that any person trips coming into the study area with their destination in the same area as the PnR facilities will not likely use the PnR facilities or guideway transit, but go directly to their final destination. Therefore, only the trips that have destinations toward the central or opposite end of the study area from their origins are being considered as EI trips for this study. These trips have the most potential for using the PnR facilities and transit to get to their ultimate destination. This methodology was used primarily for forecasting candidate EI trips for the guideway system. Appropriate access was coded for the two bus loops along their corresponding routes, portions of which are outside of the study area.
The forecast year of the
original
The following Table 5 shows the summary of trips as calculated to the 2030 future year horizon. The highlighted trips from row 4 to columns 2 and 3, and the trips from row 6 to columns 1 and 2 represent the EI trip totals.
Table 5
2030 External Trips
External to
Internal Trip Distribution
As mentioned above, the EI trips distribution was preserved from the original Branson model using the same Friction Factors and Skim file, as derived from “skimming” the Highway network. The trips used, as described above as candidate trips for the PnR facilities and transit, had only their origins collapsed into one of the two TAZs representing the PnR lot locations. From these two TAZs, the EI trips either proceed by the highway network or access the transit network to get to their final destinations within the study area.
MODE
CHOICE AND ASSIGNMENT
A mode choice model was developed for this study to determine an acceptable mode split (ratio of highway to transit trips) within the study area. The three modes designated for study are auto trips, transit trips by walk to bus, and walk / bus access to a fixed-guideway system that runs almost exclusively down State Route 76. The mode choice components to calculate the utility values needed include walk to transit times, highway and transit vehicle travel times, transit wait times, access and egress, auto operating costs, and transit fare cost.
After the mode choice calculations, the final transit trips by mode are assigned to the transit network. This allows for the true unlinked ridership by each transit route and mode to be determined, since some of the fixed-guideway ridership comes from bus access on the network in addition to walk access.
Model Validation
Model validation is a key component in the development of a suitable model to forecast transit ridership. Ensuring that model forecasts reasonably match existing transit ridership is important in order to properly forecast future ridership. Since there is currently no transit service in the Branson area, a comprehensive review of transit models used in other tourism based markets was conducted. These include:
·
·
·
Miami/South
·
In order to ensure that the Branson model included appropriate sensitivities to the introduction of transit as well as changes in transit characteristics, a number of transit related parameters were evaluated from the above listed models.
The following parameters relating to transit usage and mode choice were reviewed and incorporated into the Branson model as appropriate.
· Mode Bias Constants
· Auto Operating Costs
· Access to transit coefficients
· Wait and transfer time coefficients
· Transit fare coefficients
Appendix 1 lists the parameters used by the Mode Choice model.
ALTERNATIVES TESTING
Three primary fixed guideway/bus alternatives were tested within the Branson State Route 76 corridor for the 2030 forecast year. Each alternative was tested with a transit fare of $.025, $1.00, $1.50, $2.00, and no fare. It was assumed that transit fares were consistent by mode and there was no transfer fare imposed.
Transportation System Management (TSM) Alternative
The TSM alternative
represents the FTA mandated baseline scenario that the build alternatives
will be compared against. The
TSM alternative includes the Brown Line which is a six-mile-long bus line
extending down
Build Alternative A
Alternative A is made up
of an elevated guideway route on the State Route 76 Strip stretching
between the east downtown and west
In addition to the
alternatives listed above, a future northwest extension using the
right-of-way of the State Route 465 Ozark Mountain High Road extension to
reach Shepherd of the Hills and
Operational Characteristics
Operating headways (the time between transit vehicles arriving at a stop)
for the TSM Alternative’s Brown, Green, and
The average speed for the fixed guideway system, with half-mile station
spacing, was tested at an average of about 15 mph.
The average operating speed for the bus service was tested at an
average of about 12 mph on the 76 Strip and 20 mph on the color-coded
routes.
RIDERSHIP FORECASTS
2030 Ridership estimates were forecasted for the three alternatives listed above. Ridership forecast results are illustrated in Table 6.
Table 6
2030 Branson Average Daily Boardings
|
|
|
Transit
Fare |
||||
|
Alternative |
Mode |
No
Fare |
$.025 |
$1.00 |
$1.50 |
$2.00 |
|
TSM |
76 Bus |
3,508 |
3,083 |
2,130 |
1,650 |
1,276 |
|
Bus |
1,517 |
1,323 |
895 |
695 |
526 |
|
|
Build A |
Guideway |
14,452 |
12,949 |
9,320 |
7,421 |
5,874 |
|
Bus |
2,966 |
2,622 |
1,818 |
1,389 |
1,078 |
|
|
Change from TSM |
Guideway |
10,944 |
9,866 |
7,190 |
5,771 |
4,598 |
|
Bus |
1,449 |
1,299 |
923 |
694 |
552 |
|
|
Build B |
Guideway |
16,623 |
14,891 |
10,669 |
8,460 |
6,690 |
|
Bus |
3,735 |
3,315 |
2,285 |
1,779 |
1,372 |
|
|
Change from TSM |
Guideway |
13,115 |
11,808 |
8,539 |
6,810 |
5,414 |
|
Bus |
2,218 |
1,992 |
1,390 |
1,084 |
846 |
|
Changes in transit fares results in an associated increase or decrease in ridership considered to be within a reasonable range for this type of transit system.
An increase in ridership in Alternative B can be attributed to increased access to destinations such as the Skaggs Health Center (a large employer and local community service facility), the Factory Merchants Mall (a major retail destination), and State Route 376 hotels and theaters, which are concentrated in the Shepherd of the Hills Expressway stretch east of State Route 76. The alternate alignment on the west end of the corridor, (Alternate B2) accounted for 1,100 average daily boardings while the alternate alignment on the east side of the corridor (Alternate B1) accounted for 200 average daily boardings.
An approximately 4 mile future northwest extension providing access to Shepherd of the Hills and Silver Dollar City was also tested and resulted in an average net increase of approximately 1,500 boardings per day.
Traffic Impacts
Travel demand forecasts indicate that the addition of an elevated guideway system along the State Route 76 corridor should have a positive impact on future traffic congestion. It is estimated that the proposed guideway system can expect to account for a decrease of between 3,800 to 11,000 daily automobile trips from the State Route 76 corridor depending on transit operating characteristics and chosen alignment.
Park and Ride Station Parking Demand
The proposed transit
system includes two park-n-ride stations at or near both the east and west
ends of the State Route 76 corridor. The
east park-n-ride facility is located at the station in the northwest
quadrant of State Route 76 and US 65.
The west park-n-ride facility is located at a station on State
Route 376 west of the
It is estimated that the east park-n-ride station average daily unconstrained parking demand will range from 860 spaces to 2,200 spaces depending on transit operating characteristics and chosen alignment. It is estimated that the west park-n-ride station average daily unconstrained parking demand will range from 650 spaces to 1,500 spaces depending on transit operating characteristics and chosen alignment.
CONCLUSION
Ridership forecasts were conducted for a proposed elevated guideway system as part of the Branson Transit Study DEIS. Forecasting methodologies used to estimate ridership in 2030 were developed consistent with standard transit forecasting methodologies used in other parts of the country.
It is estimated that the proposed guideway system can expect to generate between 5,874 and 16,623 boardings per day depending on fare structure and the final preferred alignment chosen. This estimate appears reasonable considering the heavy tourism market in the Branson area as well as the projected future traffic congestion along the State Route 76 corridor.
APPENDIX 1
Branson Mode Choice Model Input Constants and Coefficients
|
Definition |
Value |
|
Auto Operating Costs per Mile Auto Mode Constant Bus Transit Modal Constant Premium Transit(Guideway) Modal Constant* *Represents
20min IVT savings Run Time Coefficient Auto Cost Coefficient Transit Fare Coefficient Walk Coefficient Transit First Wait Coefficient Transit Second Wait Coefficient Transit Transfer Time Coefficient Transit Number of Transfers Coefficient Transit Nest Coefficient Auto Nest Coefficient Parking Cost Coefficient Terminal Time |
0.19 0.00 -0.019 0.381 -0.02 -0.13 -0.15 -0.045 -0.034 -0.023 -0.045 -0.045 0.3 0.8 0.0038 1.00 |